

The Medal Count


We are now 3 events deep into the first year of the Criterium Nation Medal Count. Hopefully you have seen the new feature on our website— The Medal Count. Or you caught Allan and me talking about it during the Season Opener show. Regardless, we wanted to spend a few moments explaining in more detail, “what” this effort is about, and the more probing question, “why” did we do this?
American racing lacks a defined baseline in terms of teams and events— a means by which fans and observers can figure out a level with which to engage with the sport. That challenge is due in no small part to the number of similar, from an outsider’s perspective, opportunities available to racers, and the ease by which entry to “prestigious” events is obtained. If you are a cat 1 (or a cat 1/2 on the women’s side) you can enter just about any criterium or road race. That before-mentioned challenge is amplified by the lack of a substantial number of UCI road events in America; and, when it comes to criteriums, the UCI is all but oblivious to what we do domestically.
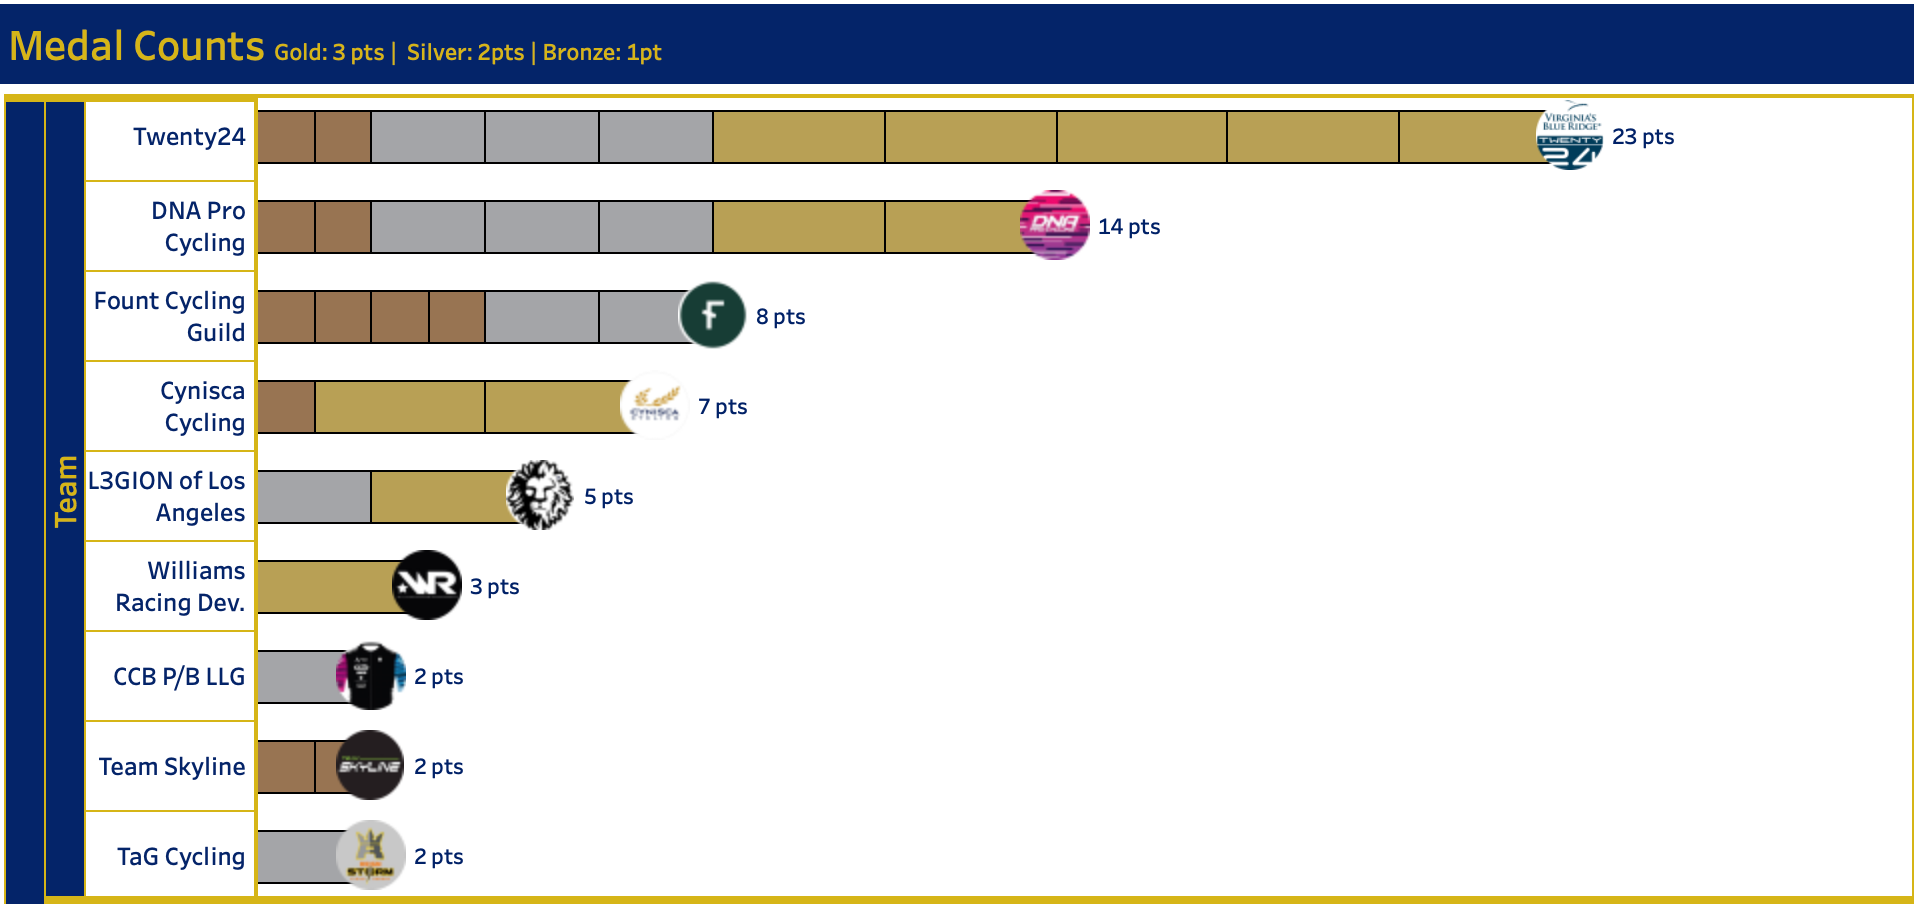
What this leads to are claims of “eliteness” and social media posts that contain unsubstantiate-able statements of grandeur. To a large part in Europe, the center of road racing’s world, such claims are measurable against tradition, rankings, and transparency. In the U.S., while we have a transparency via Road Results, there is simply too much unfiltered information for fans to easily make sense of things. So it makes answering the all too often asked question “who is the best team in America?” difficult. We all may immediately think of teams like L39ion of Los Angeles, the former American Cycling Group, or even DNA Pro Cycling because of their social media savviness and the fact that they are regularly on the podium; however, are they really statistically the best? By how much? Who comes after them? And which way are the trends pushing?

These question are answerable in major sports like the NFL, MLB or the Premier League. There is a volume of data collected, analyzed, and displayed to fans so that water cooler conversations can be more in depth about sports than the work actually happening in the company around whose water cooler you are standing. In criterium racing we lack an ESPN, which provides information so that you can do your own analysis; or, simply take the experts’ analysis and claim it as your own.
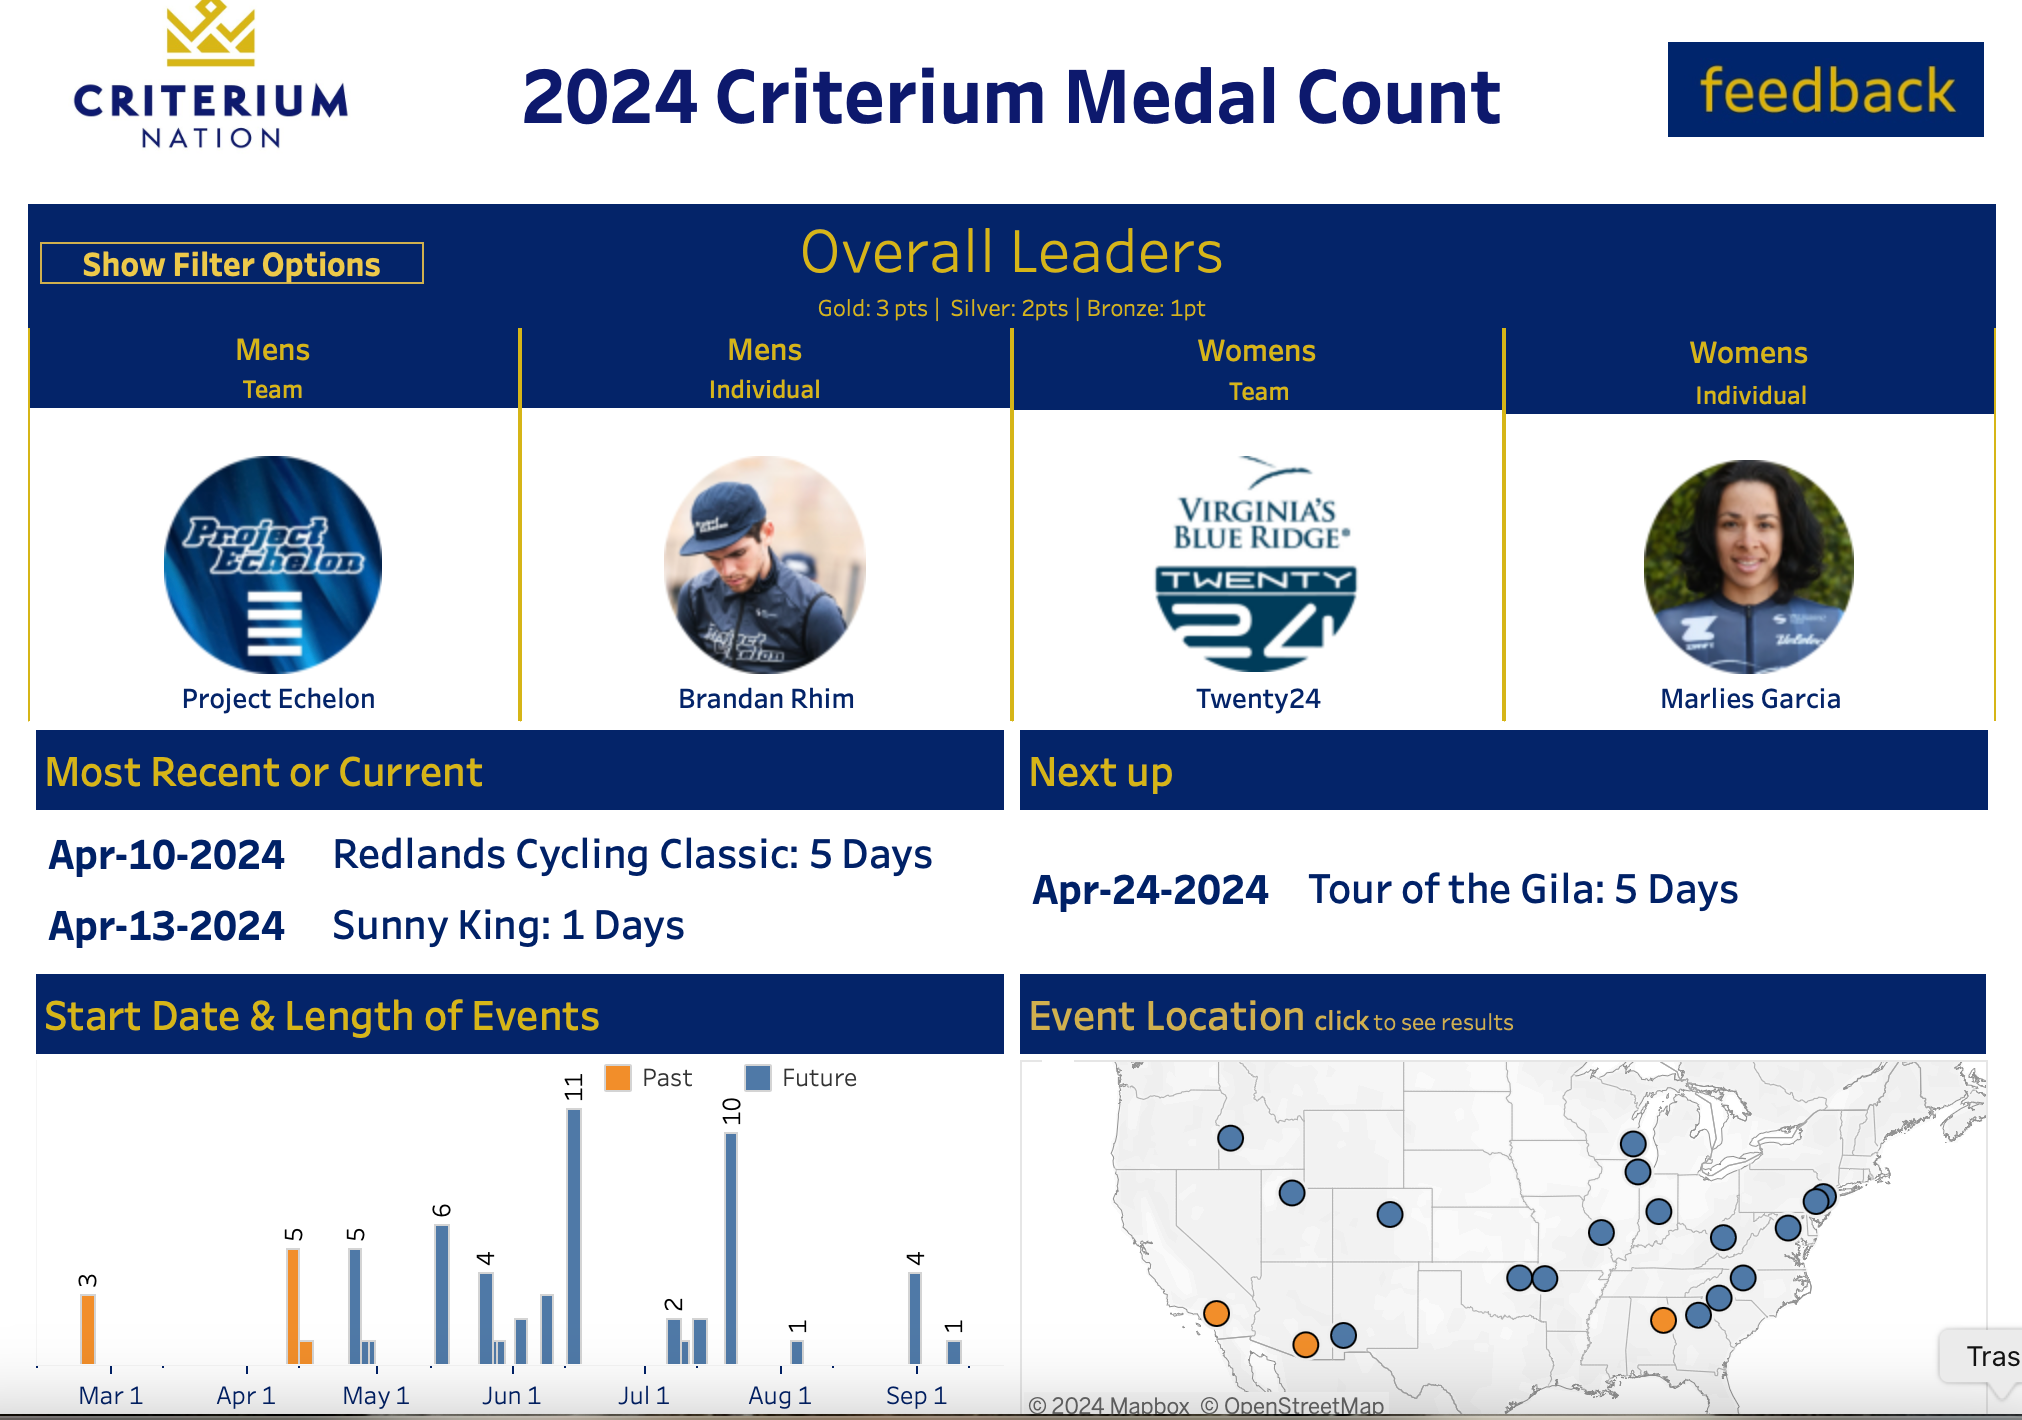
Enter The Medal Count, an idea born out of autumn riding, winter text message threads, and post-race libations. It’s our effort to create a ground level for data and conversations. To be clear, it is not meant as a competition or a replacement of the NCC, NRC, PRT, etc… Rather it is a tool built to build upon in 2025 and beyond. We took 20 of the traditionally biggest events of the year (19 now that Joe Martin has been postponed) and created a calendar. By biggest, we didn’t do a statistical analysis of racer days, impressions on social media or reach; but rather we took the schedules of the teams we followed by virtue of them being regularly on the podium and started looking for commonalities. As those commonalities increased so did the position of the events on the calendar.
In total there are 61 racing opportunities that form The Medal Count. Of those 61 there are 3 GC events— Tucson Bicycle Classic, Redlands, and Gila. There are 45 criteriums, 3 time trials, and the remaining 10 are road races. We did not include the two UCI standalone road races because that was not our audience. We were not looking to see how World Tour teams did within the domestic peloton; rather, we were focused on how American and Canadian teams did against each other (along with other nations’ teams that regularly visit our domestic races like the German 54x11 team). The events chosen include all 7 Monuments and all 8 American Criterium Cup races, along with the races that formed a part of their events, i.e. Cry Baby Hill and the other two Tulsa Tough races, or Lake Bluff and the nine other Chicago Grit races. We did that because teams tended to come for the big race within the series but also compete in the others surrounding it. We believe firmly that this is a statistically significant amount of races from a wide enough cross-section to provide useable data for our purposes.
What are we doing with the calendar? Just tracking podiums, both individual and team. Honestly, it’s way more about the team side than the individual; but since we can pull both data sets it just makes logical sense. The caveat here is that individuals do not peak for full seasons, they peak for events. Even more so, when it comes to our level of sport, where people have full time jobs to subsidize their bike racing pursuits, it is difficult to chase a full-season goal. We understand that, and appreciate the limits. Teams, however, have a broader reach and more interchangeable parts. As we build a cache of podium information, the hope is that it becomes clear which teams among the panoply that we have in the U.S., objectively, rise to the top.
When that information is built we can move forward to 2025 where we can focus pre-season, throughout the season, and post-season on a select group of teams. We can bring you deeper and more meaningful coverage by narrowing our focus to capture the most relevant. That is not to say we ignore the outlier and the upstart. However, we can finally figure out who is the outlier and better appreciate the upstart, because data provides that clarity.
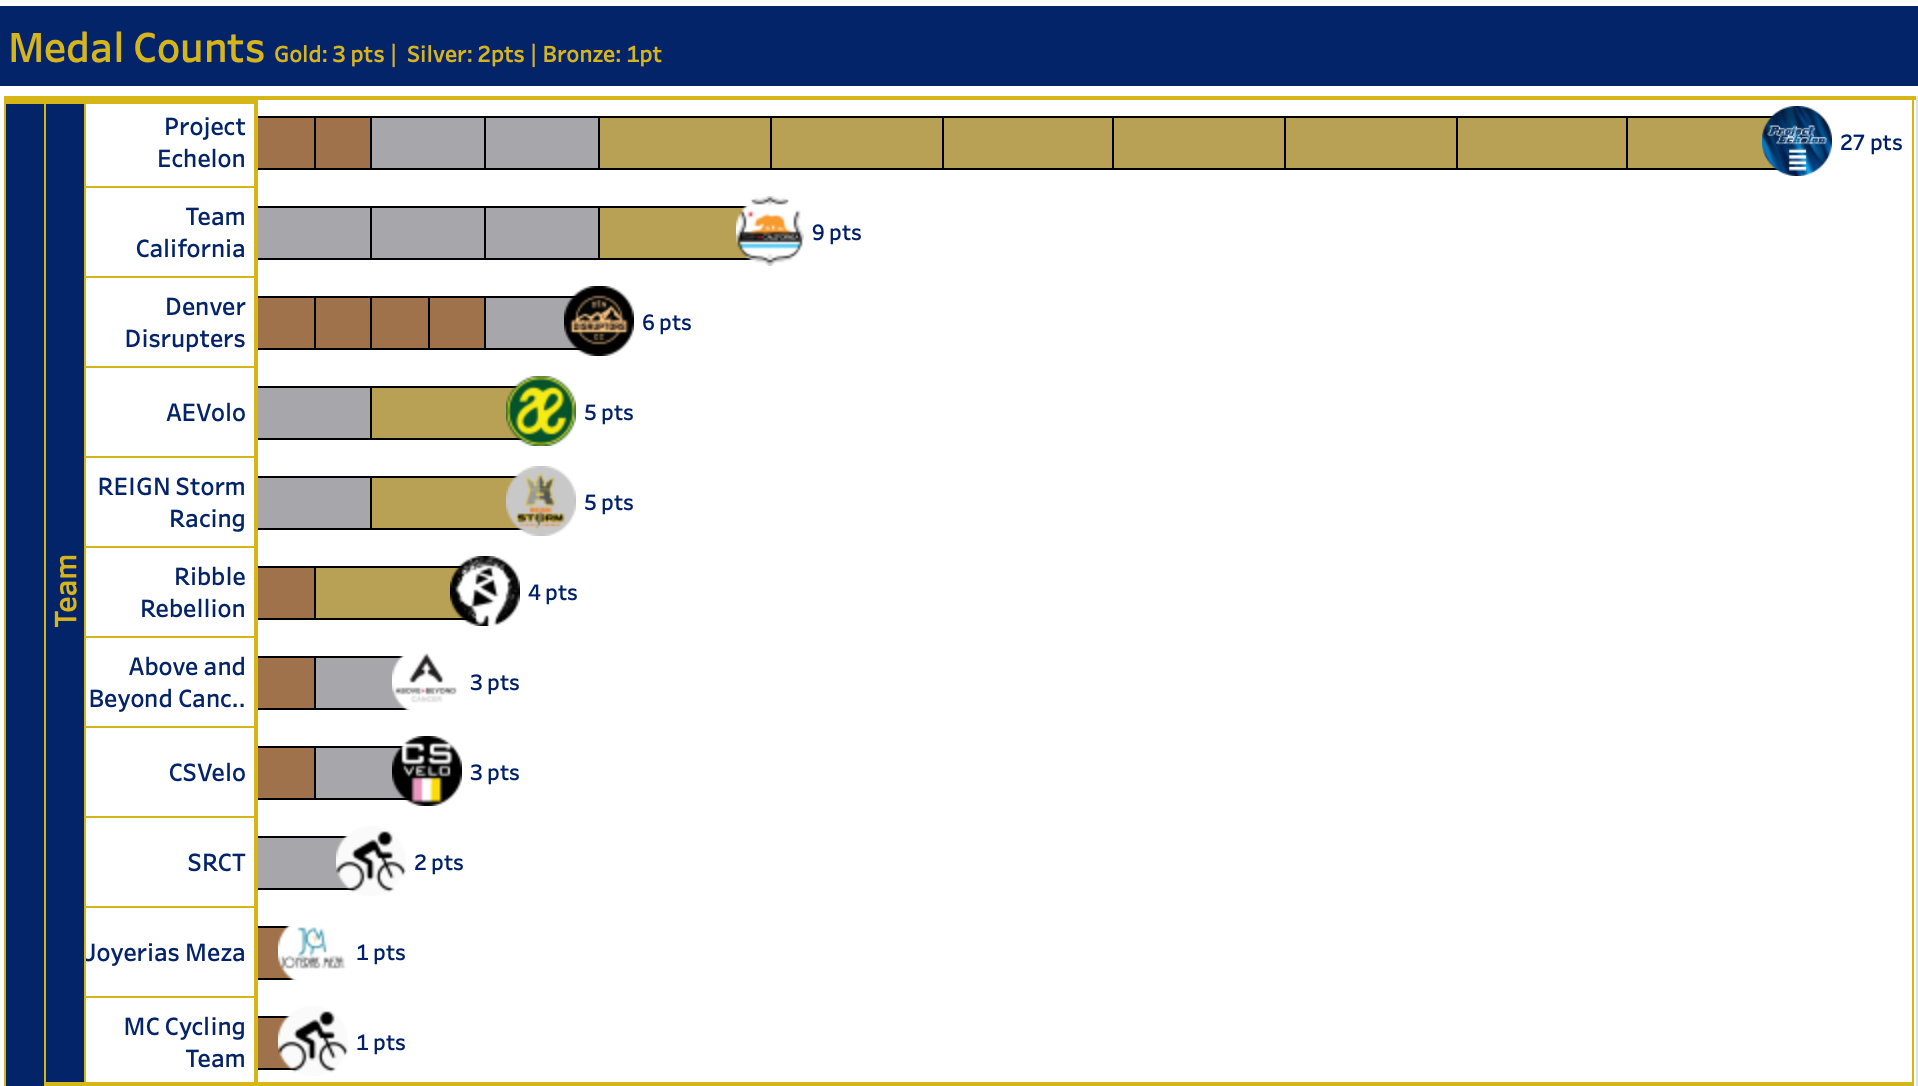
We want to pause for a moment and say thank you to Timothy Blaisdelll who is the genius behind the dashboard we are using. He has made it sortable and a place that you can filter data to inquire deeper. We also want to explain that we attributed points to each podium spot, 3/2/1, so math can be brought into it. It’s not meant to be a ranking system for places 1-10 but rather a way to separate 1-10 from the rest. As we grow and see what works maybe we do add a ranking system and the points become more dynamic to demonstrate the complexity of winning a GC as opposed to one stage, or between winning the national road race and a 60-minute criterium. These are all conversation points that can, and should be had as these things evolve.
This effort is built upon work from other sports and certainly has its analogies. One need not look much further than to the college football rankings systems to see how evolution occurs in a relatively decentralized sport. College football has moved from basically nothing, to the Associated Press poll in 1936 which named winners based on crowd-sourced opinions, to ultimately the playoff system that we see today. This example is relevant only to the extent that a sport needs to start somewhere, and often times it is the media which plays the role of inception.
Maybe one day long in the future we create a The Medal Count gala held in September at the Washington, D.C., convention center with fancy lights, black tie/cocktail attire, and an A-level celebrity host who will laude accomplishments on to the racers who top the competition. It certainly is a modest dream.
Please enjoy the work that we are doing with all of that in mind. Please let us know how we are doing with it as feedback is a huge motivator for us and has proven to be the source of fundamental changes in how we display the data. We will return here from time-to-time to explain, announce, and analyze what trends we are seeing.
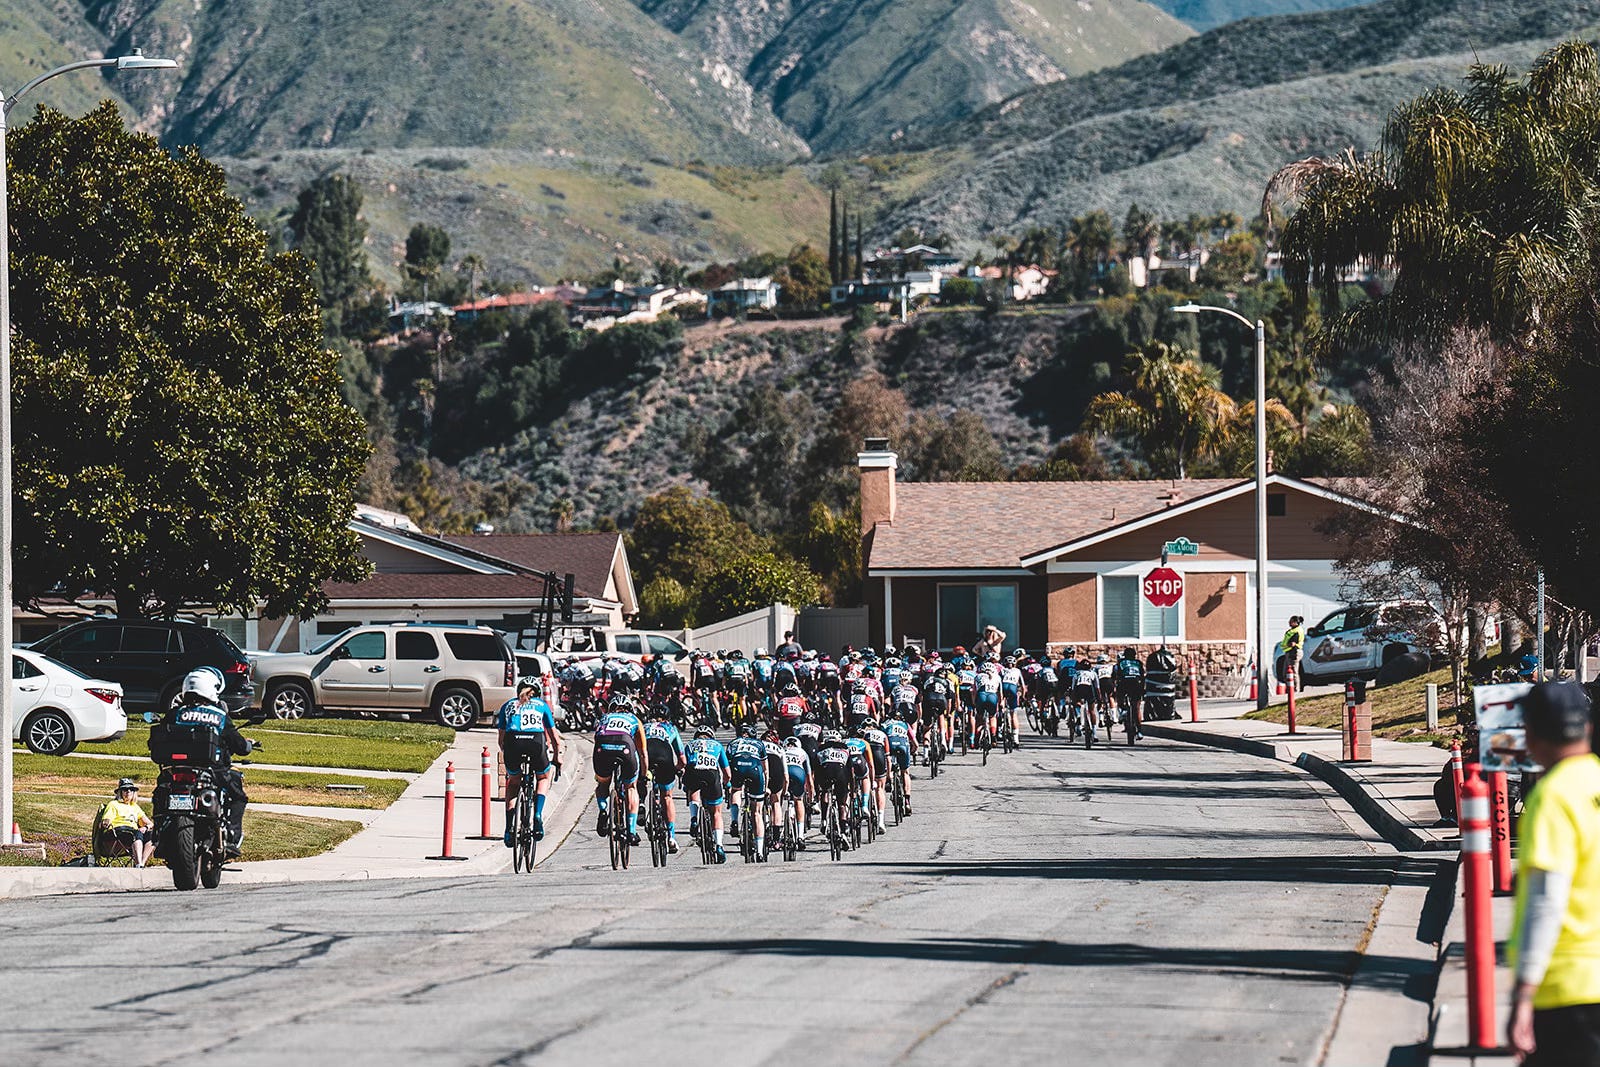
[all photos by Kai Caddy fro Redlands]
The Calendar
[POSTPONED for 2024] May 24-27: Joe Martin Stage Race, Fayetteville, AR