


The 2025 Medal Count
Year Two of our season long calendar is improved and ready to kickoff


There are a lot of events in North American racing; in fact, there are a lot of events just in the United States. That certainly borders on a good problem to have. However, for fans of the sport, it becomes challenging to determine what events fit the definition of regional, national, or FOMO. As commentators and analysts, this good problem made our jobs difficult because we were getting torn in multiple directions every weekend, just like our elite teams and riders.
Enter the Medal Count, an idea that started on a delightful fall weather ride in Connecticut. The effort was simple: create a calendar of twenty events that have historically drawn the best teams. To that, we added an Olympic-style table where we tracked who finished on the podium— gold, silver, and bronze, as both individuals and teams. By the end of the year, we developed a table of the best ten teams in the United States, men and women.

The graphics started in what could best be described as a dot matrix. Fortunately we were contacted by Timothy Blaisdell, a veteran with the Project Echelon foundation, who knew how to build tables on Tableau. Then we were really off to the races, literally and figuratively. By the end of the year, we realized that we had done something special, but there were certain limitations on what we had created. In addition, it became apparent that quickly locating results and manually inputting them into our table proved challenging and was a source of potential errors. Like all good cyclists, we headed into the offseason keen to build and improve.
Our goal was to automate and expand. Recording only the top 3 finishers created a certain level of data, but it meant we didn’t get the most out of our analysis. We also noticed that there were many repeat visitors to the podium, which made our overall presentation shallow. In addition it sacrificed the ability to identify trending riders and up-and-coming talent. However, we were pushing the limits of our technical skills. Fortunate for us, way back in the first season of the podcast we interviewed Colin Reuter, the genius behind road-results.com. We reached out to him, and his response was an enthusiastic “you know I live for this shit.”
A few dozen emails later we had a working system in which our spreadsheet pulled directly from open-source results. Now, we could move to phase two, what parameters to set, and what limits we could push. For 2025, we are expanding to include the top ten finishers in each race that is a part of the calendar.
That brought us to scoring. Last year, we did a simple point system, with 3/2/1 points awarded for gold, silver, and bronze. We ranked riders and teams by their total accumulated points. That points system seemed fair for such a small selection, but for ten places deep, we could expand and complicate things. For that purpose we tapped into the former MABRA Road Cup p/b Properties on the Potomac rules. In that competition, we weighted wins and podiums over the lower places to incentivize those riders who take a chance, i.e., they risk it for the biscuit. We decided to do that again here with the following points table:
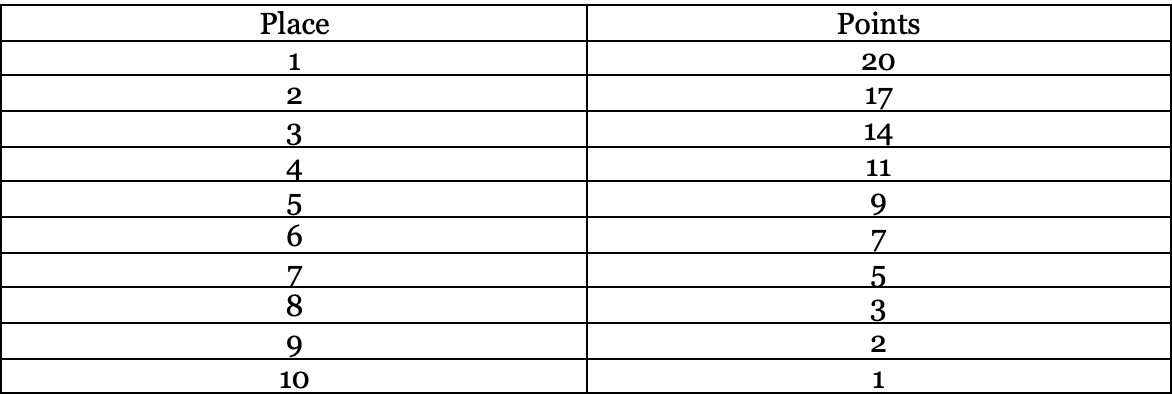
There is a 15% reduction in points between first and second, but a bonus for finishing on the podium over the bottom six positions. You also see a rapid decline in the lower third of the top 10. Simple math that continues to prioritize winning but rewards riders who were in true contention for victory over those in the impressive but more distant placings.
In the individual and team competitions, these points are simply cumulative. This means that if your team stacks five riders in the top ten, you collect five riders’ worth of points. We understand that rankings in other publications limit team scoring to the top three finishers per team. That is a valid way to do it, but we viewed it differently— team depth has a huge influence on racing and it should be fully recognized. Also, not all teams are equally sized when they roll into a race. If this was the Tour de France with a mandated roster of eight, the top-three ranking approach would make more sense. But in American racing, where some teams start races with eight riders and some with two, we think that every points-scoring finisher needs to be counted.
Another thing we learned from last year is that our calendar of ranked races was too large. We had initially selected 20 events with 65 starts. That was far too bold an undertaking. More importantly, we had events on conflicting dates or with near-impossible travel requirements between them. We wanted to make sure that in 2025 our Medal Count reflected performance and not race attendance— quality over quantity. This year, we trimmed it down to 15 events while adding in 2 new ones that were not in their last year.

As you may recall, this calendar is geared towards domestic competition, not the rare World Tour events on North American soil. We wanted to see how our primarily domestic elite teams and UCI Continental squads stacked up against each other. To that extent, we limited the competition to our national level events and UCI.2 races like Gila and Joe Martin (should it ever return). One event we removed from the calendar was our national championship. This was a tough one to work through, but both the men’s and women’s road races were dominated by World Tour pros last year, and added little relevant data for our mission. Plus, in 2025, the Nationals events will conflict with other staple races that deserve recognition and attendance as well. Winning a medal at Nationals is a huge accomplishment and we are sure that any riders that do so won’t be concerned with the lack of Medal Count points this year. Ultimately, we settled on these events:

In chronological order, new for 2025 is Tour de Bloom, our first calendar spot for a Pacific Northwest event. Bloom has grown in the last couple of years, drawing bigger and bigger talent, and for the women, it will be a UCI 2.2 this year. It has also expanded in the days, and this year, it will feature the Ed Farrar memorial road race, named after the father of legendary Garmin/Slipstream sprinter Tyler Farrar.
Also new is the Memorial Day weekend entrant along the Delaware River in Pennsylvania— Easton Twilight. It is paired alongside the Tour of Somerville and another New Jersey race for a solid three-race weekend. Easton has seen a steadily improving field in recent editions, and last year’s victory by Lucas Bourgoyne in challenging conditions, to say the least, won the hearts and minds of many. Easton features a super challenging course that sees a lot of attrition and a race that is 75 minutes long for both men and women—making it not for the faint of heart either. Plus, the live-stream production quality of Ron Short’s drone and on-the-bike camera by Daniel Holloway made it worth watching.
Two concepts that were strongly suggested to us included 1) rider and team rankings, and 2) weighting events. We will explore how to use the data produced here to rank riders and teams this year. We may even be able to generate ESPN-style power rankings. So please stay tuned. The second idea, weighting events, is a 2026 idea for now. There is certainly precedent for it, in the UCI rankings and even in the MABRA Road Cup. However, we prefer to take baby steps as we carefully develop the Medal Count. We’ve built in a lot of time between Tucson and Redlands, so we can troubleshoot any hiccups that may develop.
As with last year, this effort is all about troubleshooting, tweaking, and seeing what we can do with the data. We learned a lot from the first season of The Medal Count, and hopefully, this year, we will learn even more. As always, we appreciate your input, which is why we left a feedback button for you to make suggestions.
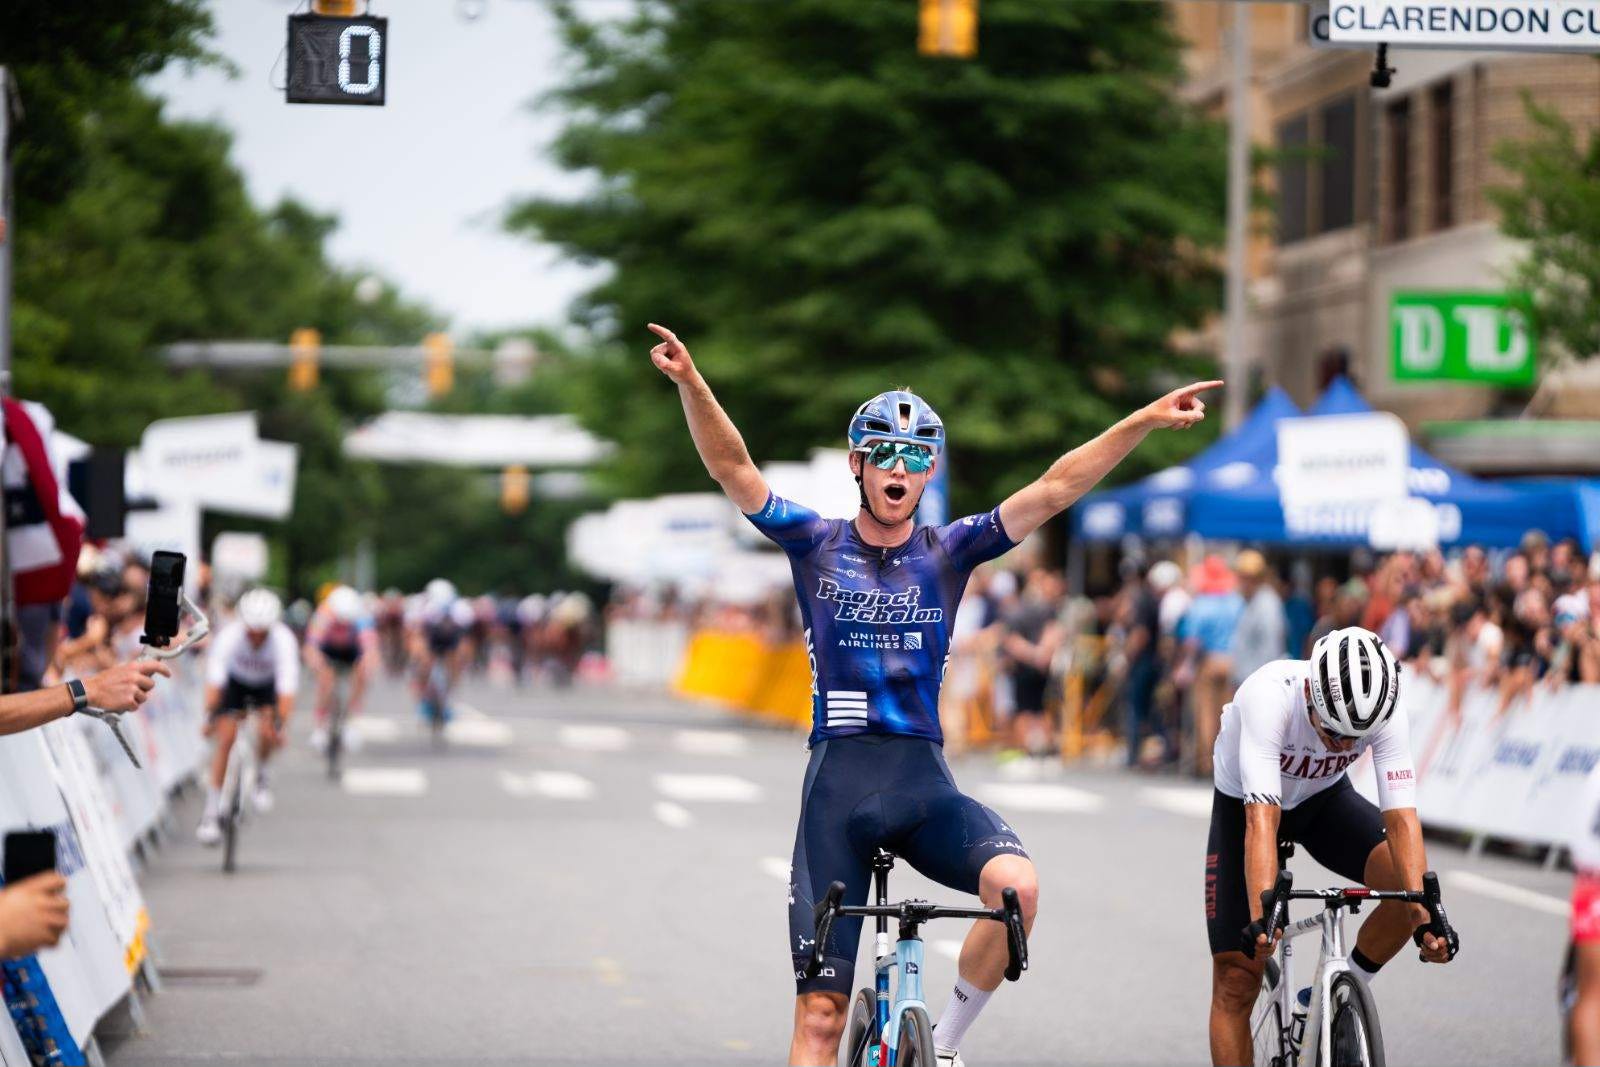
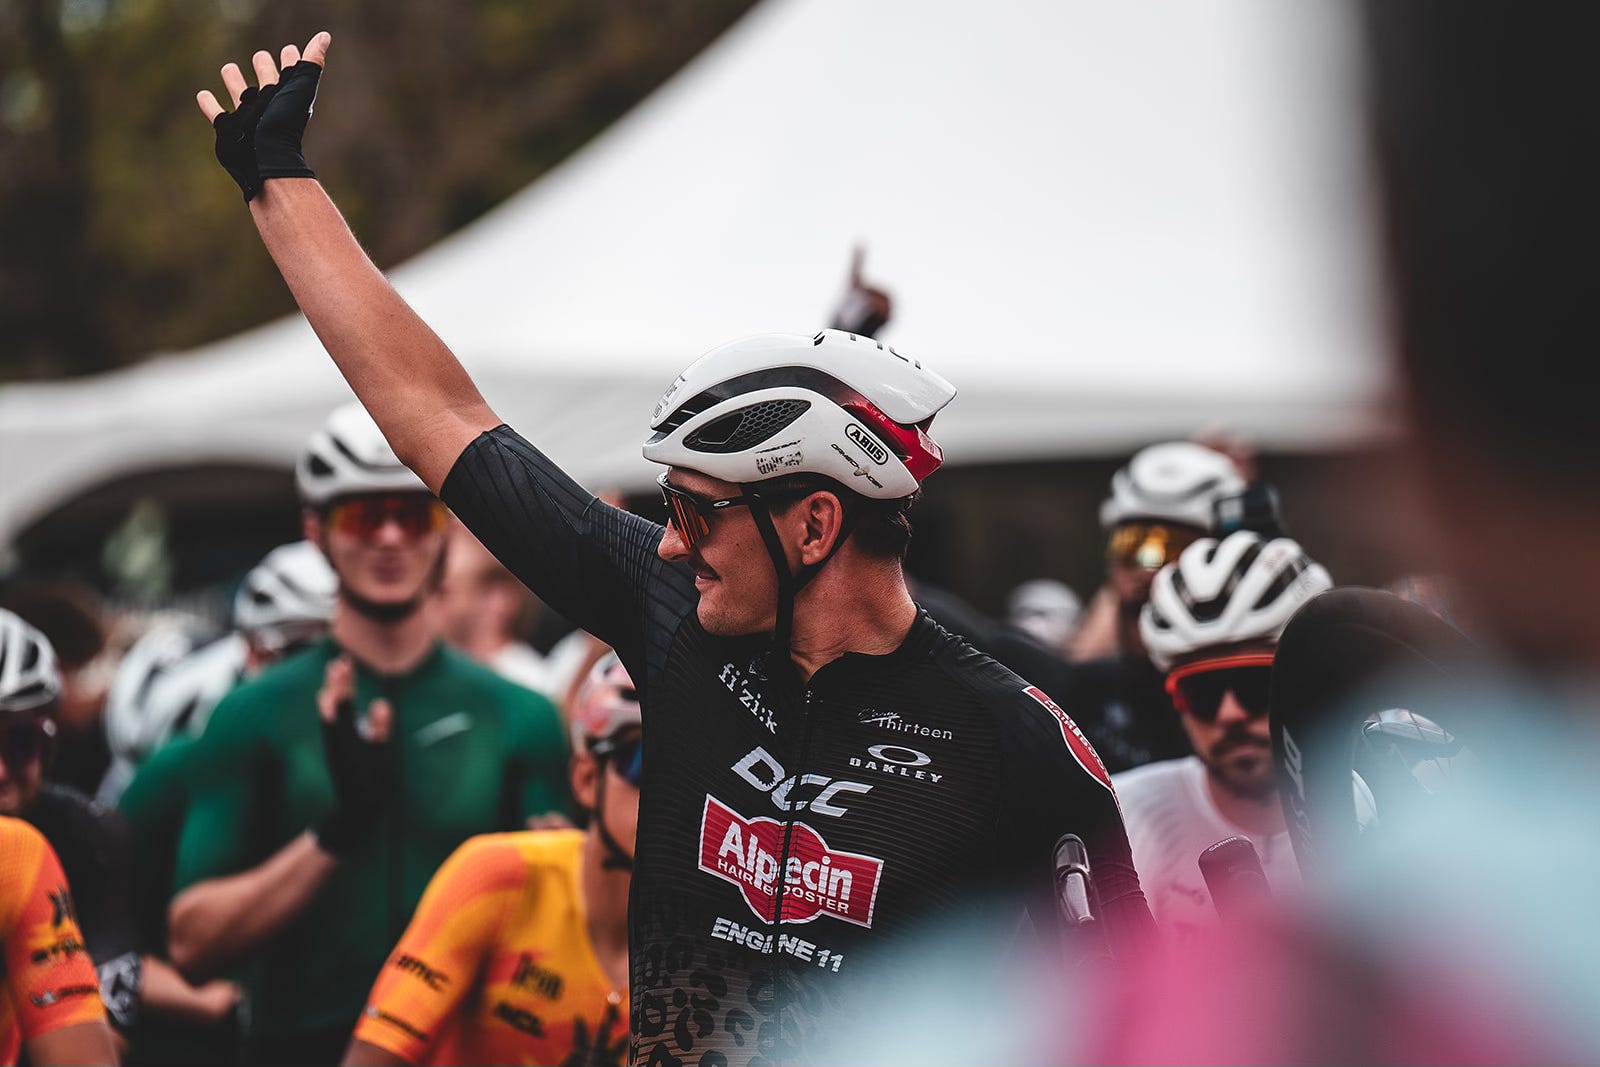
Photos by Kai Caddy
I don’t understand- for the stage races are you scoring individual stages, the GC, or the criteriums?
Personally I would just score the criteriums to maintain consistency